SaaS Content Marketing 101: A Comprehensive Introduction for SaaS Founders
Discover Kalungi's ultimate guide to SaaS content marketing! Learn proven strategies to build trust, engage your audience, and drive growth.

You’ve worked tirelessly to build a great SaaS product, onboard customers, and drive revenue. Yet, month after month, customers quietly slip away, leaving your growth stagnant. That silent killer? Churn.
Churn is the pulse of your SaaS business. It reveals how well your product solves customer problems, the strength of your onboarding, and the loyalty of your user base. Get it right, and you’ll build a predictable growth engine that scales effortlessly. Get it wrong, and you’ll struggle to keep up with the competition.
But here’s the challenge: Churn isn’t one-size-fits-all.
What’s a good churn rate for a startup might be a red flag for an enterprise SaaS. With multiple ways to calculate it and benchmarks that shift with market dynamics, it’s easy to feel overwhelmed.
In this guide, we’ll break it all down:
If you’ve ever wondered how your churn rate stacks up—or how to improve it—you’re in the right place.
Churn is one of the most critical metrics for any SaaS company because it directly impacts your ability to scale and sustain revenue growth. But to tackle churn effectively, you first need to understand what it is, how it manifests, and why it happens.
Let’s break it down.
At its core, churn refers to the loss of customers or revenue over a specific time period. For SaaS companies, churn is a KPI that highlights the rate at which users stop using your service.
There are two main types of churn metrics SaaS companies track:
Churn is also a signal. It tells you whether your product delivers enough value to retain users and where you may be falling short in your customer journey.
Not all churn is created equal. Understanding its types will help you analyze and address it effectively:
Understanding why customers churn is essential for reducing it. Here are some of the most common reasons:
Churn is a window into the health of your SaaS business. It reveals the strengths and weaknesses of your growth strategy.
High churn rates create a "leaky bucket" scenario, where even a steady influx of new customers can’t offset the revenue lost to churn. This directly impacts revenue growth and retention, making it harder to scale sustainably.
Additionally, churn has a significant effect on customer acquisition costs (CAC). Acquiring new customers is expensive, and reducing churn improves the return on investment (ROI) of your marketing and sales efforts by maximizing the value of each acquired customer.
For venture capitalists and investors, churn rates are a key indicator of business stability and growth potential. High churn rates can signal deeper issues within your SaaS offering, which may lower your company’s valuation and hinder funding opportunities.
Customer lifetime value (CLV) is another area affected by churn. A high churn rate shortens the average lifespan of your customers, reducing the total revenue each customer generates over time. This can have a compounding effect on your bottom line, as retaining customers is typically more cost-effective than acquiring new ones.
Lastly, churn plays a key role in predictability and forecasting. Lower churn rates lead to more stable and predictable revenue streams, enabling your business to plan more effectively for the future and make informed decisions about growth strategies.
Churn rates can vary widely depending on how "sticky" your SaaS solution is, and this stickiness often correlates with revenue numbers and company size. While not a perfect metric, these correlations provide a useful starting point for benchmarking your churn performance.
For early-stage startups, it’s common to see churn rates around 10% of revenue, with some even reaching as high as 15-20%.
That's pretty good, right?
Until you realize those figures represent monthly churn. At 10% monthly churn, you’d essentially be replacing your entire customer base every 10 months.
The reality is often a bit more nuanced. Lower-revenue customers typically churn faster, while higher-revenue clients tend to stick around longer. Even so, a healthier benchmark to aim for is a 2% churn rate, especially for established SaaS companies.
A good benchmark SaaS churn rate to aim for is 2%
For enterprise solutions with annual recurring revenue (ARR) above $10,000-12,000 per customer, the target churn rate should be even lower, reflecting the higher cost of switching and deeper integration of your product into customer workflows.
To help you understand your B2B SaaS company’s churn rates, let’s explore churn rates by company size and the rationale behind SaaS churn benchmarks.
Churn benchmarks vary significantly based on company size, customer type, and pricing model. Here's what you need to know:
For small to medium-sized businesses (SMBs), which typically bill monthly, you’ll see a churn rate between 3 and 7%.
If your SaaS company targets SMBs, you’re more than likely to see a monthly churn rate between 3 to 7%. However, when you look at it from an annual standpoint, you’re going to see between the ranges of 36 to 76%.
When it comes to SMBs, their business models create an environment for customer churn, especially before reaching their PMF. Additionally, businesses that purchase software from SMBs tend to do so in a lower price range, which leads to a lower switching cost based on the subscription model, for example:
Now that we’ve established a baseline for SMB SaaS companies, it’s time to look at churn rate benchmarks for enterprise SaaS companies.
When targeting large enterprise companies with a product or solution priced for thousands of dollars, you should aim for a churn rate as low as 1%.
If you think about it, the higher the SaaS product’s cost, the less likely people are willing to switch due to costs associated with implementation, training, and switching. However, lower churn rates are based on the assumption that you’re an established SaaS company. If you’re a start-up, expect your churn rate to be slightly higher.
Why do larger enterprise companies have lower churn rates?
A majority of large enterprise SaaS companies target larger customers, which significantly impacts churn. This is due to several factors, including:
Many factors can affect your churn rate and the accuracy of the calculations, from too few customers to variations in contract renewal periods and more. To understand if your churn rate is acceptable, consider the following:
Calculating churn is a key exercise for any SaaS company.
Whether it’s tracking lost customers (customer churn) or lost revenue (revenue churn), churn metrics offer critical insights into your product’s performance, customer retention strategies, and overall business health.
Knowing your churn rate enables you to:
To effectively track and understand churn, SaaS companies must rely on key formulas. Each approach provides unique insights into customer retention, revenue stability, and areas for improvement.
In the next section, we’ll explore both foundational and advanced formulas to help you accurately calculate churn and understand its impact on your SaaS growth trajectory.
Customer churn measures the percentage of customers who leave your services during a specific time period—monthly or annually. It’s an essential starting point for assessing product-market fit (PMF) and identifying areas for improvement.
%20(1).webp?width=549&height=110&name=Customer%20Churn%20equation%20(1)%20(1).webp)
For example, if you have a total of 100 customers and see 2 customers churn per month. In this case, your annual churn rate will look like this:
.webp?width=410&height=114&name=Customer%20Churn%20Calculation%20(1).webp)
This means your monthly SaaS customer churn rate is at 2%. Simple, right?
Customer churn gives you a quick view of how many customers are leaving your service but doesn’t account for variations in customer value, which brings us to revenue churn.
Now let’s look at the next type of churn: revenue churn.
A software company's revenue churn considers the percentage of monthly recurring revenue your company loses due to your customers leaving your product or services. Measuring revenue churn is a sure giveaway of your company’s real losses or what's costing your company’s revenue growth.
.webp?width=616&height=113&name=Revenue%20Churn%20equation%20(1).webp)
Think of revenue churn like this. In comparison to customer churn, revenue churn considers the different pricing models you charge your customers. It provides a granular view as it calculates your MRR instead of the number of customers.
For example, let’s say you have 10 customers paying your gold tier subscription of $10,000 per month and 10 customers paying $1,000 per month for the bronze tier subscription. In this scenario, you’ve lost 3 gold-tier and 7 bronze-tier customers. Here’s what your calculation would look like:
MRR calculation:
%20(1).webp?width=528&height=87&name=MRR%20Calculation%20(1)%20(1).webp)
Revenue churn calculation:
%20(1).webp?width=670&height=90&name=Revenue%20Churn%20calculation%20(1)%20(1).webp)
This means your monthly revenue churn rate is at 2.6%. An important note to consider: you can use both churn rates in your monthly reporting. While customer churn helps your company see the number of staff you’ll need to manage your accounts, revenue churn evaluates your overall financial health and performance.
Now that we’ve established how to calculate the above, it’s time to consider the different factors that affect churn rates.
Below is a list of four SaaS formulas you can easily follow to help you gain visibility into your customer base:
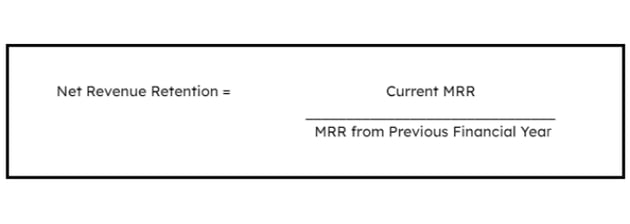
Net revenue retention measures the total change in recurring revenue from a pool of customers over time. NRR is one of the most comprehensive metrics to measure churn. It tells a complete story: both the positive impact of price changes and the negative impact of lost customers.
You will need the following numbers to calculate your net revenue retention:

Retention is an important number to know. Customer acquisition cost (CAC) in the SaaS world is expensive—to gain $1 in annual recurring revenue (ARR) per customer, the average cost is $1.32. Maintaining your existing customers costs less—down to $0.71 per customer.
The higher your NRR, the more likely it is that your business provides valuable offerings to your customers. Established companies consider 125% a good number, and startup SaaS companies see rates even higher than that.
Once you know your NRR, you can evaluate if you’re happy with your number or if you need to start implementing new strategies to entice your customers to stick around.
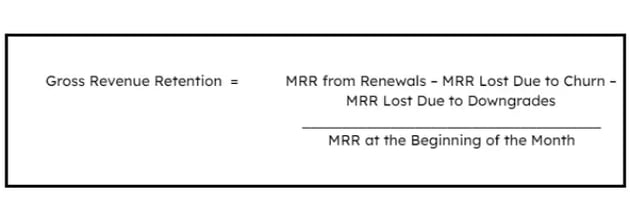
Gross revenue retention measures annual revenue lost from your customer base. GRR indicates how your company is really doing over time when it comes to retaining revenue from your customers. This metric will always be equal to or lower than your net revenue retention.
To calculate gross revenue retention, you need to know the following:
However, keep in mind that the MRR for each current individual customer cannot exceed the MRR for that same customer last year.

While GRR will always be less than 100%, a good rule of thumb is to have the ratio closer to 100 than 0. The lower your GRR, the less likely VCs are to invest in your business because it indicates that your business isn’t viable in the long run.
If you have a low GRR, it’s time to take a serious look at customer retention and work to lower your churn.
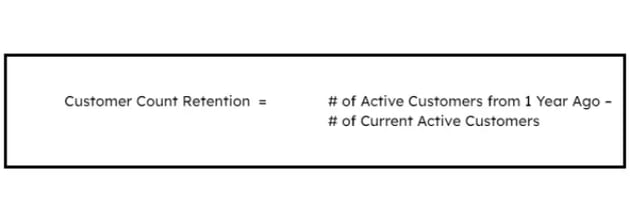
This metric is often used in conjunction with net revenue retention. It’s based on the count of active customers from one year ago—and how many of those customers are still active today.
Customer count retention treats all customers as financial equals, which tends to overstate the impact of churn.
In order to calculate customer count retention, you will need to know the following information:

You want a high CCR rate. This metric is useful because it takes a step back from a purely financial standpoint and adds color to the picture. You can more easily grasp weaknesses in your customer retention strategy that metrics such as NRR or GRR overlook.
Remember: these formulas are here to help you get an idea of how churn impacts your company. For a holistic view of churn, use a combination of metrics:
I recommend you:
Evaluate what’s working—and what’s not. Take advantage of the lower CAC associated with retaining customers and use these SaaS churn metrics to your advantage. Identify your superpowers and strengthen their impact.
Knowing your SaaS churn rate and applying strategies to reduce it could be the difference between VC funding or not, so don’t skip out on this important information.
Accurately calculating churn is crucial for understanding the health of your SaaS business, but it’s easy to fall into pitfalls that can distort your data. Miscalculations can lead to flawed strategies, poor retention efforts, and missed growth opportunities.
Let’s explore some of the most common mistakes SaaS companies make when calculating churn—and how to avoid them.
Accurate churn calculations are the foundation of effective retention strategies. By avoiding these common pitfalls and adopting a holistic approach, you’ll gain actionable insights into your SaaS business.
Get the calculations right, and you’re well on your way to creating a growth engine that scales.
Understanding and managing churn is key to your SaaS company’s growth and profitability. Whether you’re navigating the high churn rates of SMB customers or striving to maintain low churn for enterprise clients, having the right strategies in place is essential.
At Kalungi, we specialize in helping SaaS companies like yours tackle churn head-on. From optimizing retention strategies to benchmarking your churn rates against industry standards, we provide the expertise you need to drive sustainable growth.
Ready to take control of your churn? Schedule a free discovery call with Kalungi today and let’s work together to scale smarter.
While both terms describe customer loss, churn in SaaS typically refers to the loss of paying customers or revenue, whereas attrition can encompass broader contexts, such as the disengagement of free users or inactive accounts. In SaaS, churn is a more precise metric for measuring financial impact.
The average customer lifespan depends on your churn rate. For example, a churn rate of 5% per month implies an average customer lifespan of about 20 months. Enterprise SaaS companies generally experience longer lifespans due to higher customer retention compared to SMB-focused SaaS businesses.
Churn prediction models use data analytics and machine learning to identify patterns and behaviors associated with customer loss. These models often incorporate metrics like usage frequency, customer support tickets, and engagement levels to predict the likelihood of churn and help SaaS companies intervene proactively.
Gross Churn: Measures the revenue lost from customer downgrades or cancellations without accounting for upgrades or expansions.
Net Churn: Factors in both revenue lost and gained (from upsells or cross-sells), offering a more comprehensive view of overall revenue retention.
Yes, a churn rate can be negative when the additional revenue from upselling or expanding existing customer accounts exceeds the revenue lost due to cancellations or downgrades. Negative churn indicates strong growth and high customer satisfaction.
SaaS companies should calculate churn rates monthly to monitor short-term trends and quarterly or annually to gain a comprehensive view of retention and growth. Regular tracking helps identify patterns and make timely adjustments to retention strategies.
No, trial users typically aren’t included in churn calculations since they haven’t converted to paying customers. However, tracking trial-to-paid conversion rates is a valuable metric for understanding onboarding effectiveness and product-market fit.
Fadi co-founded Kalungi in 2018 with Stijn Hendrikse. He has over 20 years of experience in marketing and building businesses. He is a certified HubSpot Champion User.
Discover Kalungi's ultimate guide to SaaS content marketing! Learn proven strategies to build trust, engage your audience, and drive growth.
Meet Amec Velásquez, Kalungi's Head of Web Development. Discover his journey, insights on web dev trends, and how Kalungi empowers B2B SaaS companies.
Discover why hiring a SaaS Fractional CMO is the smartest move for B2B SaaS startups, and how Kalungi's Fractional CMOs can help you achieve T2D3.
Be the first to know about new B2B SaaS Marketing insights to build or refine your marketing function with the tools and knowledge of today’s industry.